The HyperFlex profiler tool is very cool. It shows you some more insight about an environment which you then easily can convert into a new HyperFlex system.
Now it’s possible to not only have more information about your VMWare environment, but also for your Hyper-V / Baremetal environment.
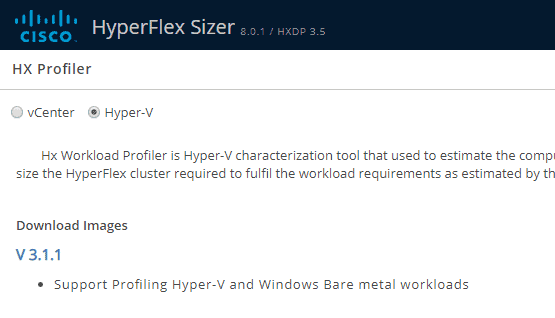
 Where to download the HyperFlex Hyper-V Profiler ?
You can find the HyperFlex profiler tool at : http://cs.co/hxsizer. When you click HX Profiler you now see that you can choose for vCenter or Hyper-V. In this case I am clicking on Hyper-V and then click on the V 3.1.1 link.
 One thing I really like, is the help. If you don’t know how to configure things, just search for the doc at the help.
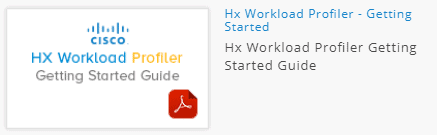
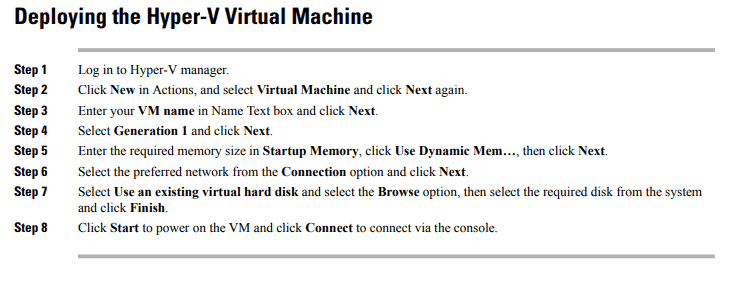
In this doc you will see all the step for deploying the profiler.
Installation of HyperFlex Hyper-V profiler
When you downloaded the .zip file, please extract it to a folder. We will be using this file later on.
On a server, Windows 2016 with Hyper-V is running. Let’s create a new virtual machine.
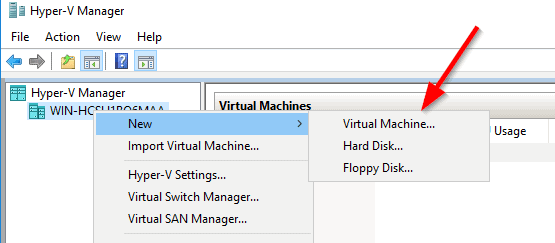
Just give the VM a name and a location where to store the VM’s.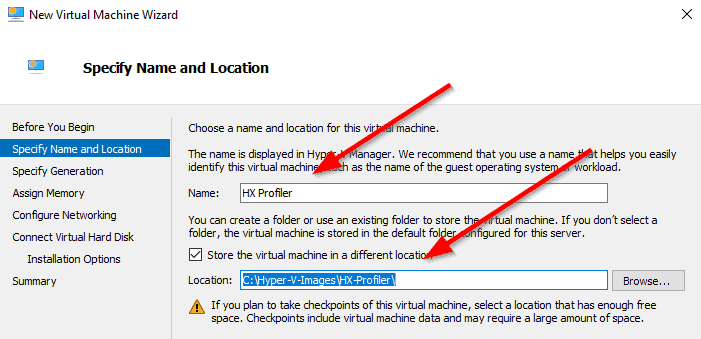
Let the default of Generation 1 checked.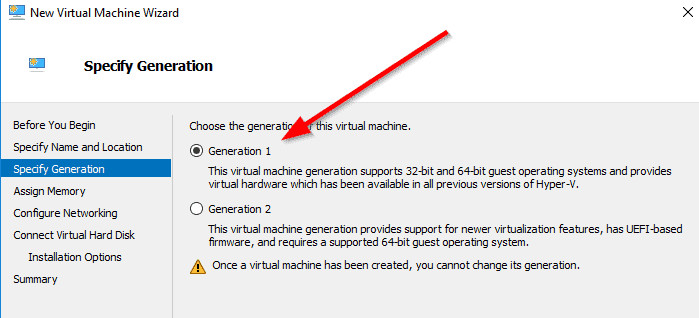
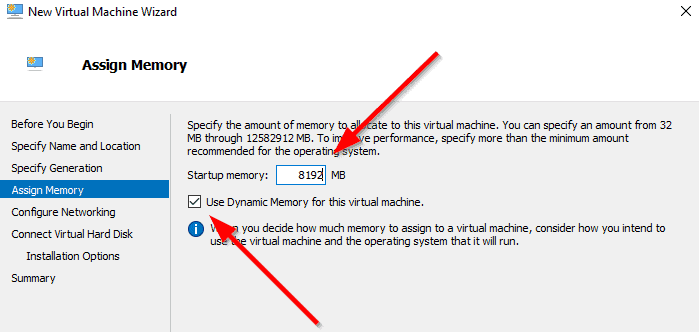
The recommendatin of the amount of memory for the profiler is 8192 Gb. Select the Dynamic Memory.
It would be nice that the profiler can reach the network, so select the correct network interface.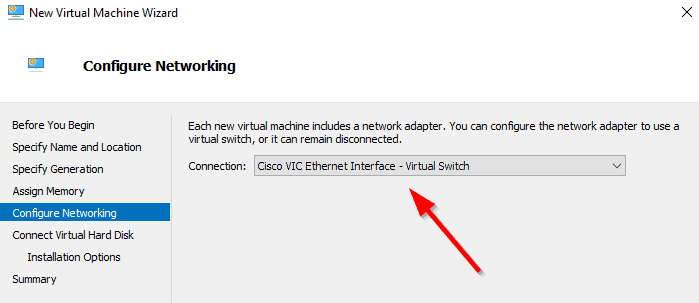
The file you had downloaded is a Virtual Hard Disk. Select the location of this file.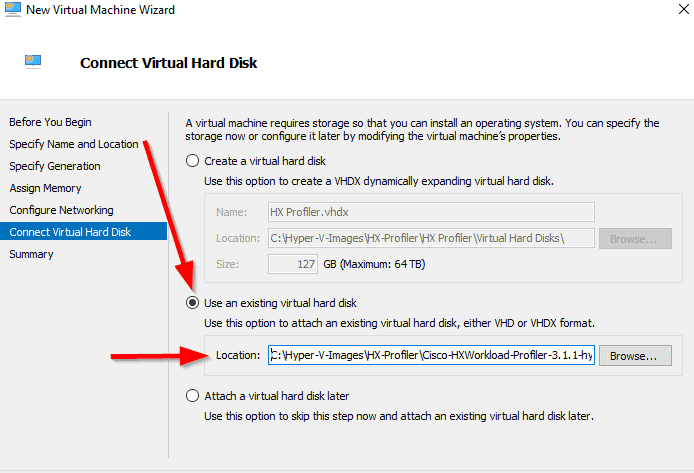
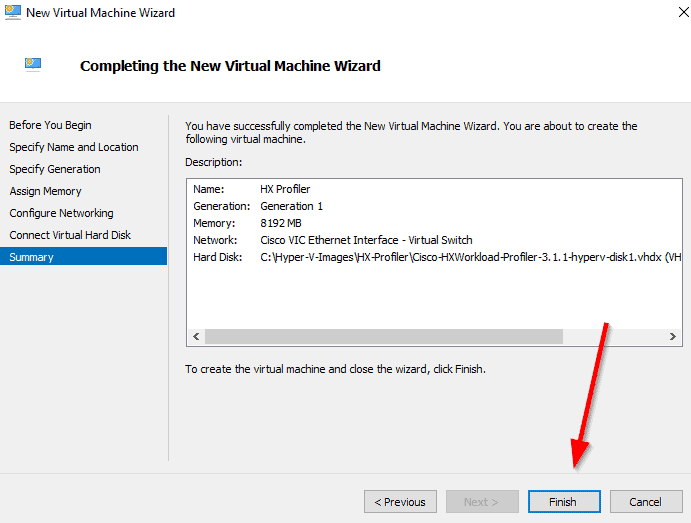
You will see a small summary and select Finish so that it will be configured.
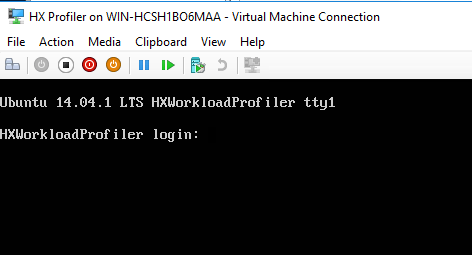
When it’s finished, just hit start at the Hyper-V manager and connect to it.
Some Tweaks
I started the VM and login into the console. I wanted to know what ip address it did get.
You can login with the credentials : monitoring / monitoring.
To view the ip address at a linux machine, you can use the command : ifconfig

As you can see, I only see the loopback interface and not an ethernet interface.
I had to remove the remarks in front of auto eth0 and iface eth0 inet dhcp at the interfaces file located at /etc/network

After a restart, eth0 was up and running and did get an ip address of the dhcp server.
Now you can go the webbrower and type : http://<ip address profiler>
Fill in the credentials that are needed.
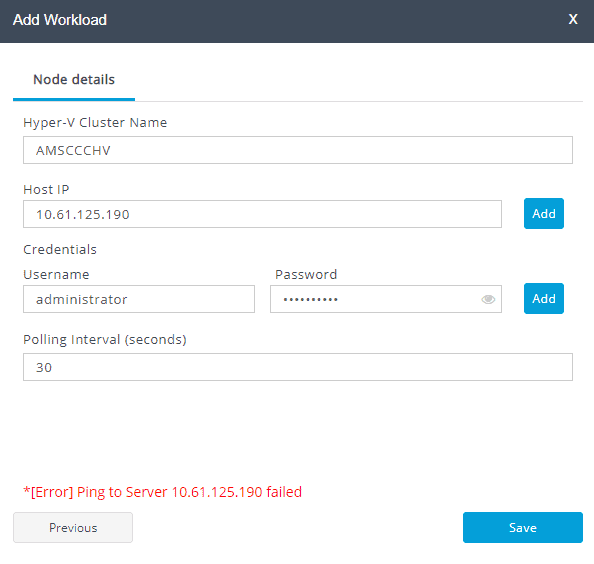 And now you see that the server couldn’t be reached.
In my case the firewall was set to default, so the ping traffic was denied.
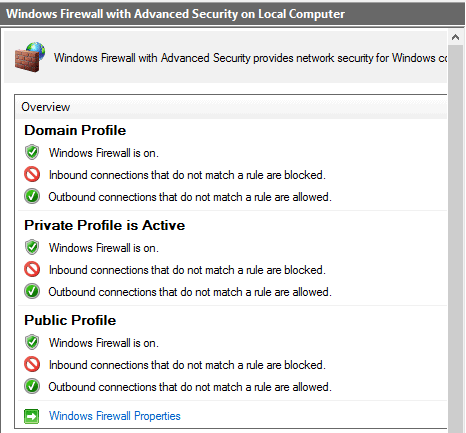
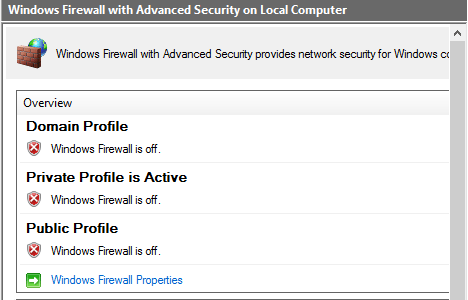
When you disable the firewalls, it’s working. So you now know you will have to tweak the firewall for icmp traffic.
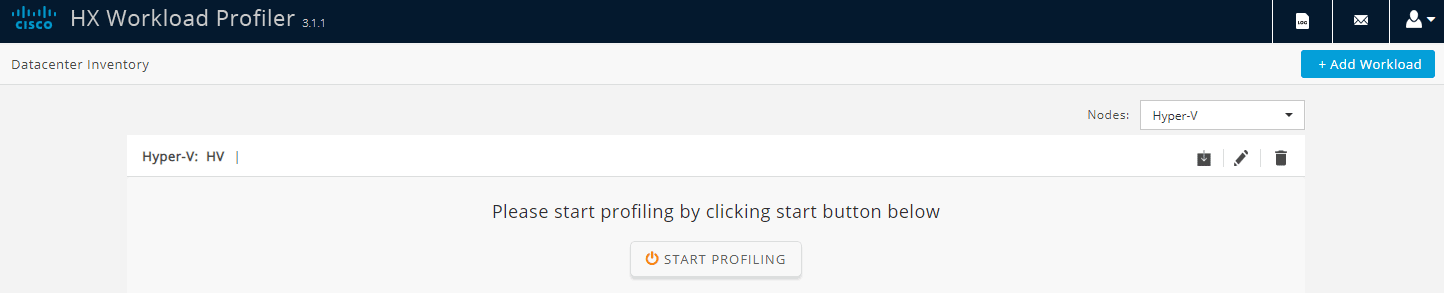
Now you can setup the profiler and start running it.
Use the HyperFlex profiler
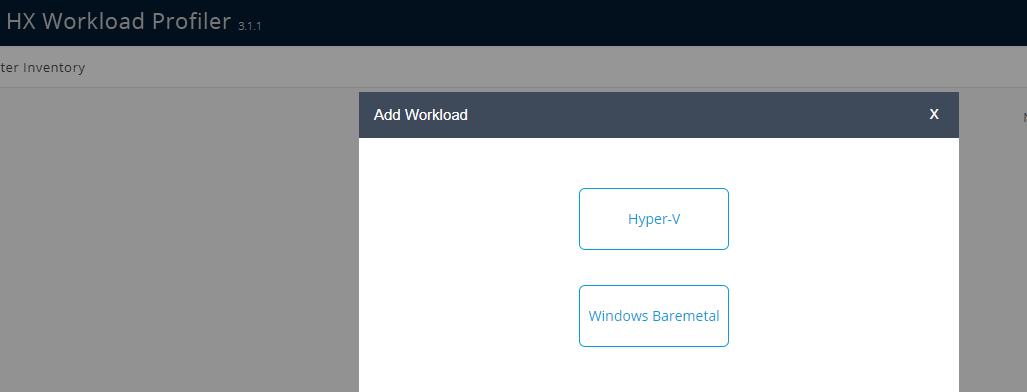
When the Hyper-V host is connected, you can start profiling.
Give the profile a name and select how long it will be running. 5 days is minimum and if you really have an environment that you will see some insights, it’s good to select the 30 days option.

Here you see that the profiling is in process.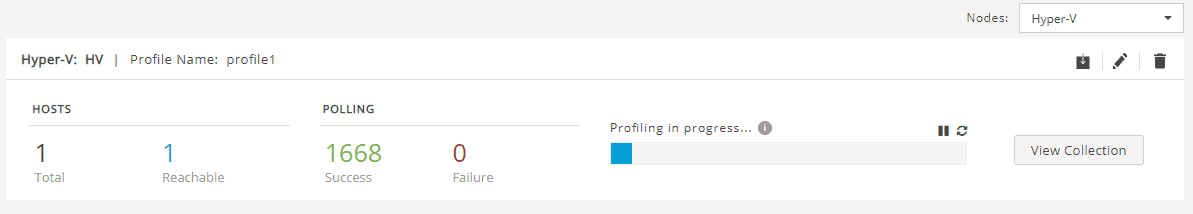
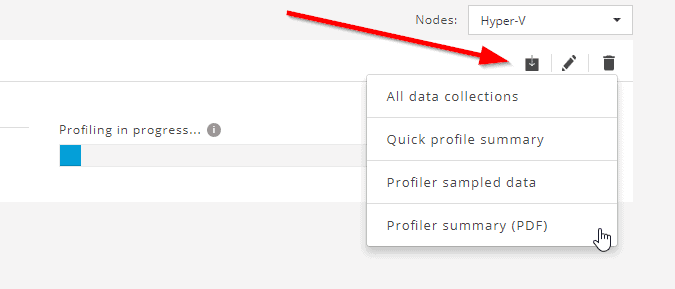
You can export the data and use it in the HyperFlex sizer tool.
When you click on View Collection, you will see the hosts with the number of VM’s.
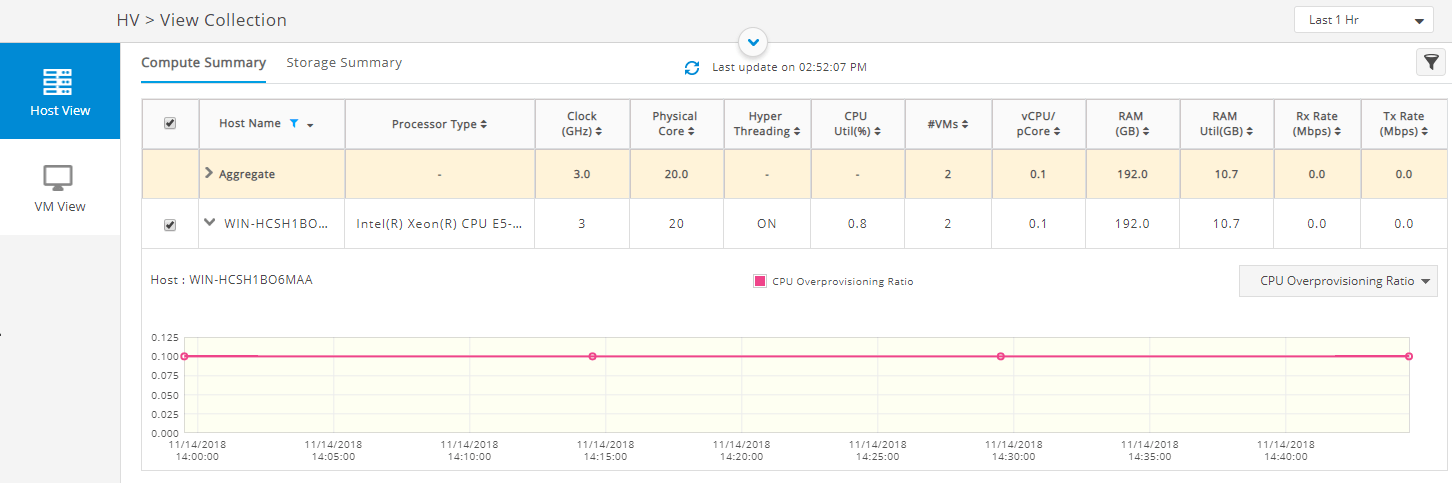
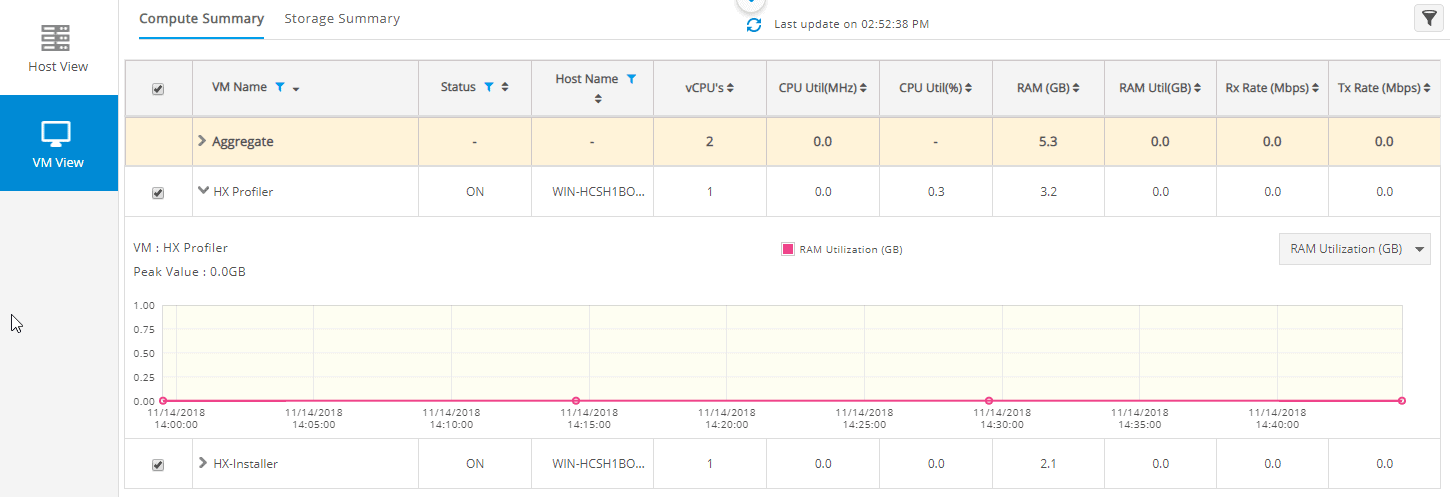
And the utilization of the VM’s. Right now I don’t have much VM’s running in my Hyper-V environment, but atleast this can give you an impression of the look and feel of HyperFlex Hyper-V Profiler.

Here are some other nice Cisco HyperFlex posts :